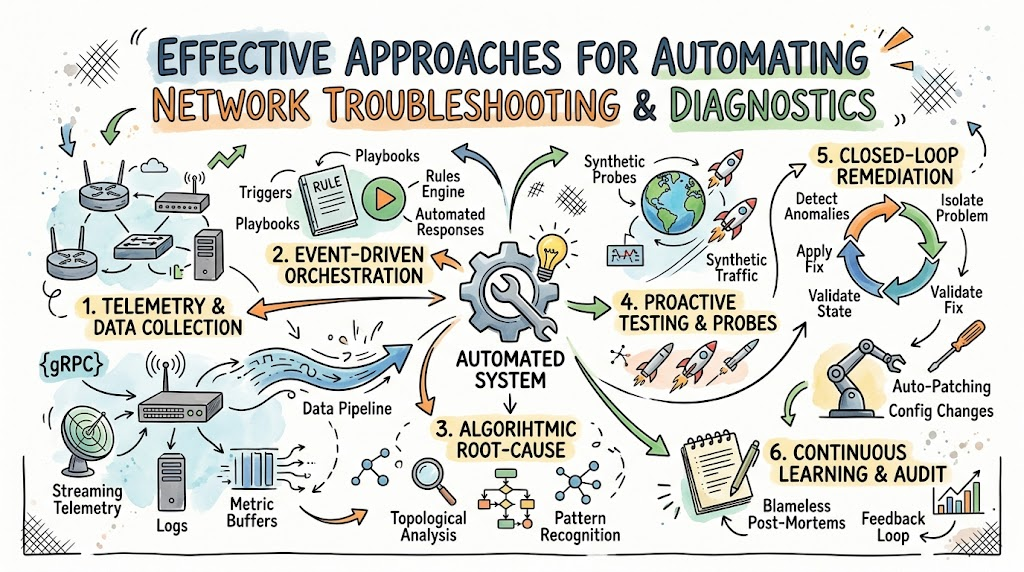
Modern digital systems require continuous, high-speed connectivity to keep services running smoothly for users worldwide. When network disruptions occur, traditional manual diagnosis methods often lead to prolonged downtime, increased operational expenses, and frustrated end users. Network teams spend excessive hours sifting through log files, pinging endpoints, and manually correlating alerts across fragmented dashboards. Consequently, organizations must shift toward programmatic verification, proactive telemetry gathering, and automated remediation workflows to maintain high infrastructure availability.
By integrating modern telemetry frameworks, event-driven orchestration engines, and intelligent root-cause analytics, operational teams can detect, isolate, and resolve anomalies before they impact critical business operations. If you want to develop hands-on engineering skills in infrastructure reliability, continuous monitoring, and automated operational workflows, explore the specialized training programs and practical learning paths offered at Noopsschool. Establishing systematic automation workflows reduces mean time to resolution, stabilizes complex routing topologies, and ensures resilient enterprise performance.
Foundations of Automated Network Diagnostics and Detection
To build an efficient automation pipeline, engineering teams must first understand the fundamental layers of network visibility and diagnostic automation. Modern distributed environments generate massive volumes of metric streams, event traces, and configuration updates across switches, routers, firewalls, and cloud gateways. Relying purely on manual inspection during an outage introduces human error and creates unmanageable diagnostic delays. Automation replaces reactive firefighting with systematic, policy-driven verification that constantly inspects data plane and control plane health.
[Telemetry & Streaming State] ---> [Event Engine / Rules] ---> [Automated Remediation] ---> [Validation & Audit Log]
Telemetry Collection and Streaming Verification
Streaming network telemetry allows devices to push operational states continuously rather than waiting for slow, polling-based monitoring mechanisms. Traditional protocols like SNMP often introduce latency and high CPU overhead on core network devices during high-stress incidents. In contrast, modern streaming telemetry uses gRPC and structured data models to deliver near real-time visibility into interface packet counters, buffer occupancy, and optical power levels. As a result, operations platforms can detect micro-bursts, interface flapping, and transient route flaps within milliseconds.
Algorithmic Root-Cause Analysis and Correlation
Once telemetry data enters the ingestion pipeline, correlation engines analyze topological dependencies to identify the underlying failure source. In large enterprise environments, a single link failure can trigger hundreds of secondary alarms across dependent services, databases, and application endpoints. Automated correlation algorithms suppress downstream noise by evaluating network graph models and pinpointing the exact physical or logical link responsible for the outage. This structured filtering ensures engineers focus directly on the core issue without getting overwhelmed by alert storms.
Policy-Driven Remediation and Event Handlers
Automated remediation leverages predefined operational playbooks that trigger specific recovery tasks whenever an alert threshold is breached. When a router detects abnormal packet drop rates on an upstream BGP peer, event handlers can automatically adjust routing metrics or withdraw announcements to shift traffic smoothly to an alternate path. These automated actions execute within seconds, preventing user-facing latency spikes and session terminations. Furthermore, these remediation engines maintain safety guardrails to prevent cascading failover loops.
Continuous Configuration Drift Detection
Configuration inconsistencies between active network devices and intended version-controlled states represent one of the most common causes of unexpected outages. Automated compliance engines continuously pull running device configurations, parse structured syntax, and compare parameters against a central repository of truth. When unauthorized changes, mismatched MTU settings, or misconfigured access control lists appear, the system flags the variance and can automatically roll back the device to a validated baseline state.
Key Operational Concepts You Must Know
Mastering automated network troubleshooting requires a thorough grasp of the operational principles that govern modern distributed connectivity. Network reliability engineers must understand how data plane forwarding interacts with control plane convergence during operational anomalies. When an automated script interacts with a malfunctioning switch, it must evaluate telemetry across multiple analytical dimensions to avoid worsening network instability. Understanding these fundamental operational concepts enables engineers to design reliable, self-healing architectures.
To effectively design self-healing systems, teams must distinguish between different monitoring techniques, automation triggers, and recovery paradigms. A balanced strategy incorporates synthetic testing, active probing, and passive flow inspection to capture both intermittent and persistent network anomalies. The following table highlights the essential operational concepts required to build reliable network automation frameworks:
| Operational Concept | Technical Definition | Primary Operational Value | Typical Implementation Tool |
|---|---|---|---|
| Synthetic Probing | Injecting simulated traffic along active paths to measure end-to-end performance metrics continuously. | Detects silent packet drops and degradation before end users experience disruptions. | ThousandEyes, Blackbox Exporter, SmokePing |
| Streaming Telemetry | Push-based metric publishing directly from network ASICs and operating system kernels. | Delivers granular, sub-second visibility without overloading control plane processors. | gNMI, OpenConfig, Telegraf |
| Event-Driven Automation | Triggering execution workflows directly from inbound telemetry alerts and system state changes. | Eliminates human intervention delays for known failure patterns and standard fixes. | StackStorm, Ansible Rulebook, SaltStack |
| State Validation | Verifying pre-change and post-change network states against declared operational baselines. | Prevents silent misconfigurations from persisting across automated deployment pipelines. | Batfish, PyATS, Suzieq |
Beyond individual diagnostic tools, teams must establish clear error-budget policies and comprehensive post-incident feedback loops. Tracking metrics such as Mean Time to Detect (MTTD), Mean Time to Isolate (MTTI), and Mean Time to Remediate (MTTR) provides quantitative proof of automation efficacy. When teams automate diagnostic data gathering, on-call engineers receive enriched tickets containing pre-gathered traceroutes, interface metrics, and topology diffs immediately upon incident creation. This streamlined operational context shortens troubleshooting cycles and protects critical business uptime.
Platform Implementation vs. Culture — What’s the Real Difference?
Successfully modernizing network troubleshooting requires both technical tooling and an organizational shift in engineering culture. Platform implementation provides the mechanics: APIs, orchestrators, telemetry pipelines, and programmable software interfaces that allow scripts to interact with networking equipment. However, simply installing advanced automation platforms will not resolve operational bottlenecks if the organization still relies on siloed communication, blame-heavy incident reviews, and manual gatekeeping.
Organizational culture defines how engineering teams handle failures, approach continuous learning, and collaborate across functional boundaries. A healthy automation culture views operational incidents as opportunities to build resilient software guardrails rather than instances requiring human reprimand. When teams embrace automated operations, developers, network engineers, and system administrators work together to codify operational tribal knowledge into version-controlled repositories. The list below contrasts how platform capabilities and operational culture manifest across various technical roles:
- Network Operations Center (NOC) Engineers
- Platform: Utilizing unified dashboards and auto-remediation playbooks to manage complex network alerts.
- Culture: Shifting focus from repetitive manual ping tests to authoring automated health checks and runbooks.
- Network Automation Engineers
- Platform: Developing CI/CD pipelines, state-testing frameworks, and structured APIs for infrastructure provisioning.
- Culture: Treating network configurations as software code with rigorous peer review and testing standards.
- Site Reliability Engineers (SREs)
- Platform: Integrating synthetic end-to-end network probes directly into overarching service-level objective monitoring systems.
- Culture: Advocating for standardized observability frameworks and running blameless post-incident retrospectives.
- Infrastructure Operations Managers
- Platform: Allocating enterprise cloud and computing resources to host distributed telemetry ingestion backbones.
- Culture: Encouraging team-wide automation experimentation while providing psychological safety during unforeseen deployment errors.
Ultimately, technological platforms provide the necessary execution engine, but engineering culture dictates long-term organizational success. If an enterprise purchases high-end automation platforms without training its staff or encouraging collaborative workflows, the tools remain underutilized. Conversely, an engineering team with a progressive automation mindset cannot scale without robust API-driven platforms. True organizational resilience occurs when modern platforms and a collaborative culture work in complete harmony.
Real-World Use Cases of Modern Operations
Automated network troubleshooting delivers substantial benefits across diverse enterprise environments, particularly in large cloud infrastructures, financial institutions, and global telecommunications backbones. In hyperscale public cloud platforms, automated drain-and-replace workflows handle failing physical switches without human intervention. When a top-of-rack switch experiences abnormal CRC error rates on internal fabric links, automated telemetry systems flag the hardware degradation immediately. The orchestration engine systematically diverts virtual machine workloads to adjacent racks, isolates the malfunctioning switch from the active BGP topology, and automatically dispatches a hardware replacement ticket to on-site technicians.
Another critical use case occurs within high-volume electronic trading networks where micro-second latency spikes can result in severe financial penalties. Trading platforms deploy specialized automated packet-capture appliances that monitor financial exchange gateway links continuously. When buffer occupancy increases beyond a strict baseline, automated capture filters extract relevant packet streams, analyze queue depths, and adjust interface pacing parameters instantly. This automated intervention ensures that trade execution traffic maintains deterministic transmission speeds without waiting for manual network team investigations.
Global retail and logistics platforms also depend heavily on automated branch network diagnostics to maintain round-the-clock store operations. In distributed SD-WAN environments comprising thousands of remote locations, retail stores frequently encounter localized ISP brownouts, cable cuts, and intermittent packet loss. Automated edge controllers constantly monitor link quality metrics across multiple transport circuits, including fiber, broadband, and cellular connections. When an active circuit degrades, the local edge appliance automatically steers critical point-of-sale traffic over to healthy backup connections while running diagnostic traceroutes and opening automated support tickets with the respective ISP.
Common Mistakes in Operations Engineering
A frequent error in network automation initiatives is automating broken or inconsistent manual processes without standardizing the underlying network environment first. If device configurations, operating system versions, and naming conventions vary wildly across the infrastructure, automated scripts will inevitably encounter unhandled edge cases. Attempting to write complex exception-handling logic to accommodate non-standard devices increases technical debt and leads to fragile automation pipelines. Teams must enforce standardized golden configurations before deploying automated troubleshooting and remediation workflows.
Another major operational mistake involves building unconstrained automated remediation actions that lack adequate circuit breakers and validation checks. When an automated script attempts to resolve a localized routing flap by altering link costs, it can inadvertently divert massive traffic volumes onto alternative paths that lack sufficient bandwidth capacity. This sudden shift can trigger cascading overloads, causing widespread outages across previously healthy segments of the network. Engineers must implement rate-limiting rules, blast-radius boundaries, and strict safety validation gates into every automated remediation playbook.
[Incident Triggered] ---> [Run Automation] ---> [Safety Check / Rate Limit?]
                                                      |
                         +----------------------------+----------------------------+
                         | Passed                                                  | Exceeded
                         v                                                         v
              [Apply Remediation Task]                                  [Alert Human Operator]
Finally, many organizations neglect to validate automated recovery actions through continuous testing and chaos engineering experiments. Automation scripts deployed months prior can silently break when network operating systems are patched or when API endpoints change schema specifications. If teams only discover broken automation workflows during a high-severity production outage, incident resolution times spike dramatically. Regularly executing simulated failure injections in staging environments ensures that automated diagnostic tools, event triggers, and recovery playbooks function reliably under real operational conditions.
How to Become an Operations Expert — Career Roadmap
Transitioning into an operations engineering expert requires a deliberate, structured learning strategy that bridges traditional network administration with modern software development techniques. Aspiring engineers must build a solid foundation in core routing, switching, and transport protocols before mastering programmatic scripting and cloud infrastructure. By progressively expanding technical capabilities from basic network scripting to event-driven architectures, professionals can successfully design and maintain resilient automated environments. The following roadmap outlines the key stages for developing expertise in automated operations:
| Career Phase | Primary Focus Area | Core Technologies & Protocols | Practical Milestone |
|---|---|---|---|
| Stage 1: Core Networking | Fundamental network protocols, packet inspection, and CLI administration. | TCP/IP, BGP, OSPF, Wireshark, Linux CLI | Manually capture and analyze multi-hop packet traces to isolate network drops. |
| Stage 2: Scripting & APIs | Programmatic device interaction, structured data parsing, and basic automation. | Python, Netmiko, NAPALM, JSON, YAML, RESTCONF | Author scripts to pull device operational state and parse interface health automatically. |
| Stage 3: Telemetry & CI/CD | Infrastructure-as-Code, telemetry pipelines, and continuous testing frameworks. | Ansible, Git, Docker, gNMI, Prometheus, Batfish | Build an automated pipeline that validates configuration changes against virtual test topologies. |
| Stage 4: Intelligent Systems | Event-driven self-healing networks, distributed tracing, and orchestration. | StackStorm, Kafka, OpenTelemetry, Kubernetes | Design a production-grade automated remediation system that self-heals from link failures safely. |
To accelerate your career progression, focus on building practical, portfolio-ready projects that demonstrate end-to-end automation capabilities. Create virtual network testbeds using containerized network operating systems to simulate complex multi-vendor topologies on your local machine. Practice writing event-driven workflows that consume streaming telemetry data from these virtual nodes and execute automated corrective actions during simulated link degradations. Engaging with open-source network automation communities and pursuing specialized industry training will solidify your operational expertise and open advanced career opportunities.
FAQ Section
- How does automated network troubleshooting differ from traditional network monitoring?Traditional network monitoring relies primarily on periodic polling and passive threshold alerts that require human engineers to inspect dashboards and manually run diagnostic tests. Automated network troubleshooting actively captures real-time telemetry, programmatically correlates failure symptoms, pinpoints the root cause, and can execute pre-approved remediation scripts without manual delays.
- Can automated remediation workflows accidentally make an active network outage worse?Yes, poorly designed automated workflows can cause cascading network failures if they lack proper safety checks, rate limits, and blast-radius constraints. To prevent widespread disruptions, engineering teams must build strict circuit breakers that halt automated actions and escalate tickets to human operators whenever remediation thresholds are exceeded.
- What role does streaming telemetry play in reducing troubleshooting time?Streaming telemetry pushes fine-grained metric data directly from network hardware ASICs at sub-second intervals, replacing slow, high-overhead SNMP polling cycles. This granular visibility allows automated diagnostic engines to detect transient micro-bursts, buffer overruns, and rapid link flaps that traditional monitoring tools completely miss.
- Is it necessary to learn programming languages like Python to work in network automation?Yes, learning a programming language like Python is essential for writing custom diagnostic scripts, interacting with device REST APIs, and parsing structured data formats such as JSON and YAML. Software fundamentals empower network engineers to move beyond proprietary command-line interfaces and build scalable, multi-vendor operational pipelines.
- How do synthetic network probes assist in preventing user-facing network degradation?Synthetic probes continuously inject simulated application traffic across network paths to measure end-to-end latency, packet loss, and jitter under real-world conditions. By identifying degraded routing paths before real users attempt to access services, automated systems can reroute traffic proactively and maintain uninterrupted service delivery.
Final Summary
Automating network troubleshooting represents an essential evolution for organizations seeking to maintain high availability and performance across modern distributed digital platforms. By shifting away from manual, reactive diagnostic methods and adopting streaming telemetry, algorithmic event correlation, and programmatic remediation, engineering teams can dramatically reduce service downtime. Implementing these automated workflows eliminates repetitive manual labor, minimizes human error, and accelerates mean time to resolution during critical production incidents.
Achieving sustainable operational excellence requires balancing robust technical platforms with a forward-thinking, collaborative engineering culture. Organizations must invest in standardized configurations, continuous state validation, and comprehensive safety guardrails to ensure their automation systems remain reliable and safe. As enterprise architectures grow increasingly complex and multi-cloud environments expand, mastering automated network diagnostics and self-healing systems will remain a fundamental requirement for modern infrastructure engineering success.