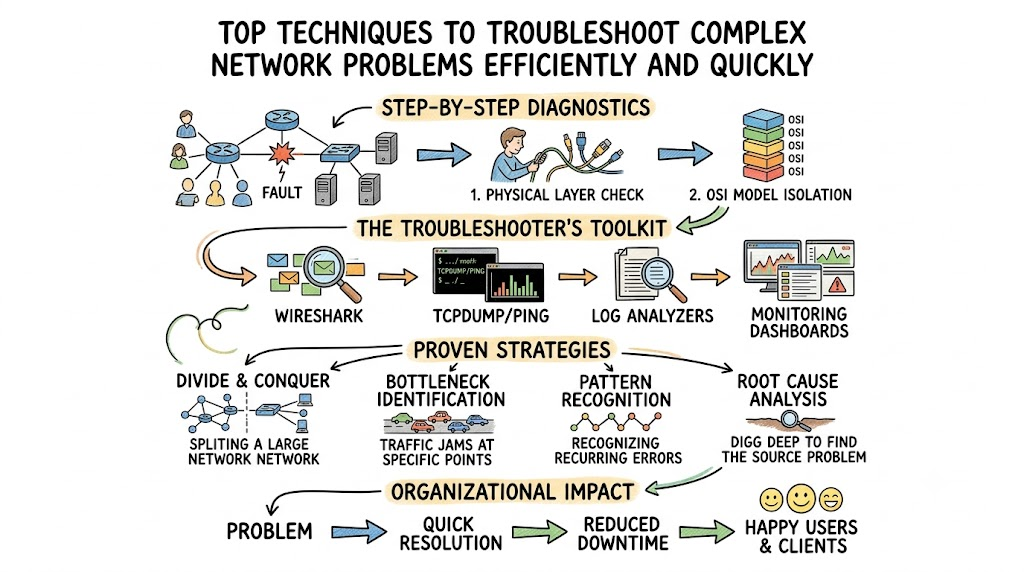
Modern digital workflows depend completely on stable, uninterrupted network connectivity to function properly. When communication breaks down, entire business operations come to a sudden halt, frustrating teams and customers alike. Diagnosing these disruptions quickly requires a structured methodology rather than random, unguided guesswork. By isolating problems step-by-step across each communication layer, engineers identify root causes with high accuracy and speed.
Developing advanced troubleshooting skills empowers technical staff to restore critical connectivity without unnecessary delays. A reliable diagnostic strategy examines everything from physical cables to distributed application services. Aspiring engineers can master practical network management techniques and structured system architectures at Noopsschool to enhance operational resilience. Adopting these proven diagnostic routines transforms chaotic outage handling into a calm, repeatable engineering process.
Core Diagnostic Frameworks for Network Investigation
Effective network diagnostics rely on standard theoretical models to systematically isolate failures. When an outage occurs, attempting fixes randomly across different systems often wastes valuable time and obscures the actual issue. Structured frameworks provide a disciplined path, enabling engineers to rule out functional components sequentially.
[Physical Layer] -> [Data Link] -> [Network/IP] -> [Transport] -> [Application Layer]
Physical Layer Verification
Physical layer troubleshooting begins by checking cables, fiber terminations, and hardware power indicators. A damaged copper wire, a loose transceiver, or a degraded patch panel instantly disrupts communication before packets can even form. Technicians must inspect physical link lights on switches and routers to confirm electrical and optical integrity. Verifying proper cable standards and signal continuity eliminates the most basic hardware failures early in the process.
Layer 2 Data Link Inspection
Data link diagnostics focus on MAC address tables, VLAN tags, and local frame delivery across switches. Address Resolution Protocol (ARP) tables must accurately map local IP addresses to physical MAC hardware addresses. When misconfigurations occur in spanning tree protocols, broadcast storms can saturate switch backplanes and paralyze entire subnets. Verifying port security settings and switch logs prevents silent frame drops at this foundational tier.
Layer 3 Network Routing Analysis
Layer 3 investigation centers on IP addressing, subnet masking, and gateway reachability across network boundaries. Engineers verify that devices hold valid IP assignments and can successfully communicate with their local default gateway. Using basic packet routing utilities helps reveal incorrect static routes or broken dynamic routing updates between autonomous systems. Ensuring routing tables contain accurate path vectors allows packets to traverse complex topologies cleanly.
Layer 4 Transport and Port Checking
Transport layer diagnostics determine whether specific service ports are open, listening, and accepting active connections. Even when an IP address responds to standard ICMP pings, the target application port might remain closed or firewalled. Network engineers use connection scanners and socket utilities to verify TCP handshakes and UDP responsiveness. Identifying blocked ports helps pinpoint strict firewall rules or crashed backend services.
Key Operational Concepts You Must Know
Systematic troubleshooting requires a solid understanding of fundamental operational concepts and performance indicators. Network engineers frequently encounter issues related to MTU sizing, DNS resolution failures, and asymmetric routing. Understanding how these factors interact prevents engineers from misdiagnosing complex network degradation.
Packet fragmentation happens when payload sizes exceed the Maximum Transmission Unit supported along the network path. When intermediate routers drop oversized packets without sending proper ICMP fragmentation notices, connections hang mysteriously. Similarly, misconfigured Domain Name System resolvers introduce significant lookup latency that feels like a total network outage to users. The table below outlines key troubleshooting indicators, their root causes, and standard diagnostic approaches:
| Diagnostic Metric | Primary Root Cause | Observable Symptom | Standard Diagnostic Tool |
|---|---|---|---|
| High Packet Drop | Saturated links or faulty hardware. | Application timeouts and freezes. | MTR, Ping, SNMP Monitors. |
| DNS Resolution Failure | Misconfigured forwarders or dead nameservers. | Inability to resolve hostnames. | Dig, Nslookup, Doggo. |
| MTU Black Hole | Blocked ICMP Type 3 Code 4 packets. | TLS handshakes stall mid-stream. | Ping with Don’t Fragment flag. |
Understanding TCP window scaling and socket buffer behavior is equally critical when debugging slow transfers. A network path may show zero packet loss yet deliver poor throughput due to restrictive receive window limits. Additionally, asymmetric routing paths can trigger stateful firewalls to drop legitimate return traffic unexpectedly. Mastering these operational fundamentals ensures that engineers diagnose both total outages and subtle performance degradations accurately.
Platform Implementation vs. Culture — What’s the Real Difference?
Resolving network disruptions swiftly demands a balance between sophisticated diagnostic platforms and a collaborative engineering culture. Monitoring platforms, automated log analyzers, and packet sniffers provide deep visibility into infrastructure health. However, having advanced observability tools is useless if engineers lack the collaborative discipline to communicate during high-pressure incidents.
An effective troubleshooting culture encourages transparent post-incident reviews rather than finger-pointing between teams. When network engineers, system administrators, and software developers share diagnostic data openly, they resolve cross-functional bottlenecks faster. Platform automation accelerates diagnostic data gathering, while a healthy engineering culture ensures teams interpret that data objectively. The breakdown below details how platform tools and team culture intersect across core organizational roles:
- Network Operations Center (NOC) Engineers
- Platform: Deploying synthetic monitoring probes and real-time topology mapping dashboards.
- Culture: Practicing standardized incident triage playbooks and structured shift handovers.
- Site Reliability Engineers (SRE)
- Platform: Automating packet capture triggers and integrating tracing telemetry into CI/CD pipelines.
- Culture: Conducting blameless postmortems to identify architectural weaknesses after major outages.
- DevOps Practitioners
- Platform: Managing software-defined network overlays and infrastructure-as-code firewall configurations.
- Culture: Validating network connectivity and latency budgets during early staging phases.
Ultimately, technological platforms provide the raw telemetry, but engineering culture dictates how effectively organizations respond to failure. Teams that rely solely on automated platforms often struggle when edge-case anomalies escape standard alert thresholds. Conversely, high-performing teams pair robust telemetry platforms with continuous training, detailed documentation, and shared accountability. This unified approach minimizes mean time to resolution and builds overall organizational resilience.
Real-World Use Cases of Modern Operations
A major enterprise data center migration highlights the critical need for structured network troubleshooting methodologies. During a large-scale workload shift, newly provisioned database clusters frequently experience intermittent connectivity drops. Engineers systematically trace the traffic path, discovering that inconsistent MTU settings across virtual switches caused packet fragmentation. Adjusting the network interface MTU values across the virtual cluster immediately resolves the intermittent connection drops.
In a global software-as-a-service environment, users often report sporadic connection resets during peak traffic hours. Diagnostic packet captures reveal that stateful load balancers are exhausting their connection tracking tables under high concurrent loads. The engineering team adjusts kernel connection limits and deploys distributed Anycast IP routing to balance incoming connections across multiple edge nodes. This strategic architectural update restores stable connections without requiring application code changes.
Another compelling scenario involves remote branch office connectivity spanning software-defined wide area networks. A regional office experiences severe audio distortion and dropped calls during unified communications sessions. Path analysis shows asymmetric routing loops caused by dynamic BGP path selections over secondary internet broadband links. Network administrators fine-tune BGP route policies to force symmetrical routing for real-time voice traffic, immediately restoring call quality.
Common Mistakes in Operations Engineering
A frequent error in network troubleshooting is immediately blaming the local service provider or internet backbone without internal verification. Support teams often spend hours waiting on external carrier tickets while the root cause sits on an internal subnet. Internal issues like misconfigured DHCP scopes or duplicate IP assignments frequently simulate wider upstream connectivity failures. Engineers must always validate internal network health thoroughly before escalating tickets to external service providers.
Another common pitfall is changing multiple configuration settings simultaneously during an active network incident. When engineers modify routing metrics, firewall rules, and DNS records all at once, determining which adjustment resolved the problem becomes impossible. Furthermore, undocumented simultaneous modifications frequently introduce secondary configuration defects that compound the original failure. A disciplined practitioner changes one single parameter at a time and verifies its exact operational impact.
Finally, many operations teams rely exclusively on ICMP ping requests to confirm end-to-end service health. A target server might respond cleanly to basic ping requests while its application reverse proxy completely fails to process incoming HTTPS requests. Relying on superficial ping checks creates false positives that mislead on-call engineers during critical diagnostic phases. True verification requires testing full application-layer protocol handshakes to confirm genuine service availability.
How to Become an Operations Expert — Career Roadmap
Transitioning into an elite network operations specialist requires a deliberate progression through networking theory and hands-on tool mastery. You should start by building a strong grasp of the OSI stack, packet structures, and routing algorithms. Gaining comfort with command-line terminal environments and low-level diagnostic utilities builds essential investigative confidence. The table below outlines a structured roadmap for developing comprehensive troubleshooting capabilities:
| Milestone Phase | Technical Competencies | Diagnostic Toolsets | Practical Milestone Goal |
|---|---|---|---|
| Phase 1: Foundations | OSI layers, IPv4/IPv6, subnetting, DNS, ARP. | Ping, Traceroute, Netstat, Tcpdump. | Trace and decode local packet flows. |
| Phase 2: Infrastructure | Dynamic routing (BGP/OSPF), VLANs, VPNs, NAT. | Wireshark, Nmap, Iperf3, OpenSSL. | Isolate complex switching and routing loops. |
| Phase 3: Automation | Infrastructure as Code, Netmiko, Python scripting. | Prometheus, Grafana, Ansible, Scapy. | Automate proactive anomaly detection. |
As you gain experience, focus on mastering deep packet analysis using advanced dissection tools. Learning to read hex dumps and analyze TCP window behavior separates average technicians from top-tier network architects. Additionally, explore how containerized networking overlays like CNI plugins function inside Kubernetes environments. Blending traditional routing expertise with modern cloud-native architecture will solidify your standing as an invaluable operations leader.
FAQ Section
- Why does traceroute show asterisks for certain intermediate network hops?Asterisks appear when intermediate routers are configured to drop or deprioritize ICMP time-exceeded messages. This behavior does not necessarily indicate a network failure if subsequent hops respond normally. It simply means that specific router ignores low-priority diagnostic requests.
- What is the most effective way to detect a duplex mismatch on a link?Check interface error counters on both connected switch ports and host operating systems. A duplex mismatch typically causes high collision counts, alignment errors, and severe throughput degradation on the half-duplex side.
- How does an IP address conflict affect devices on a local subnet?When two devices share the same IP address, switches send traffic intermittently to both MAC addresses based on fluctuating ARP cache updates. This conflict causes frequent connection drops, session resets, and erratic network behavior for both affected machines.
- Why do DNS caching issues cause intermittent web application failures?Local operating systems and browsers cache DNS records based on their Time-to-Live settings. If an endpoint IP address changes before the local cache expires, clients continue attempting connections to the old, inactive address.
- When should an engineer capture packets instead of relying on log files?Packet captures become essential when investigating protocol-level anomalies, silent connection drops, or cryptic TLS handshake failures. Logs only reveal what an application decided to record, whereas raw packet captures show the exact physical reality of the wire.
Final Summary
Mastering network troubleshooting requires a calm, structured approach grounded in proven diagnostic methodologies. Moving methodically through the OSI layers allows engineers to eliminate variables and locate root causes with precision. Avoiding common traps, such as modifying multiple settings at once or relying purely on basic ping tests, ensures efficient incident resolution. Continuous learning and regular hands-on practice remain the most effective ways to sharpen these critical engineering skills.
Integrating modern observability platforms with a blameless, communicative team culture turns troubleshooting into a significant competitive advantage. As IT environments grow increasingly complex, professionals who understand the granular mechanics of packet delivery remain essential to operational stability. Maintain your curiosity, continue refining your analytical frameworks, and treat every network failure as an opportunity to build a stronger infrastructure.