Best Tools for Network Performance Optimization
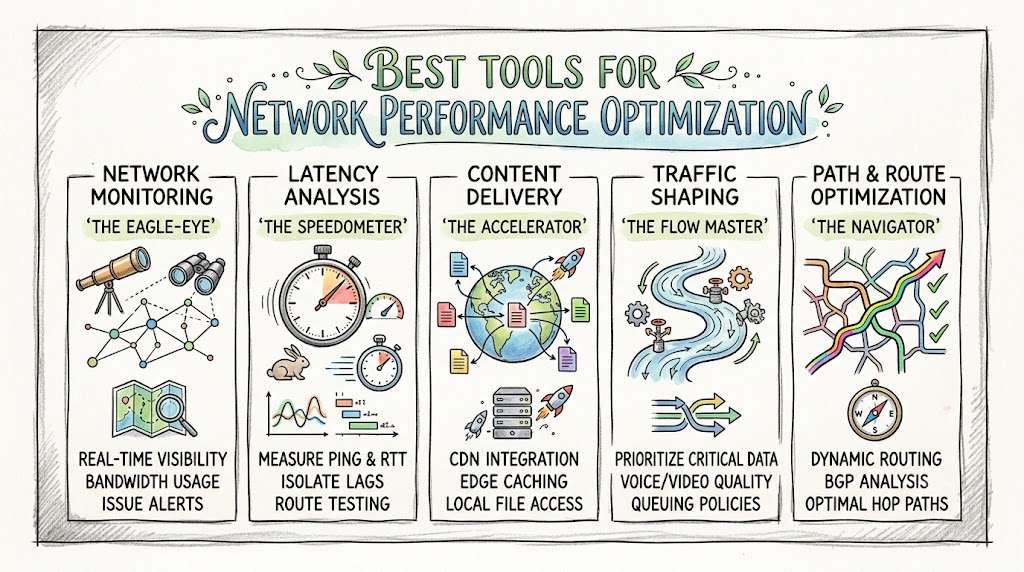
Modern digital landscapes demand flawless connectivity, making network performance optimization a survival requirement for global enterprises. When applications slow down, business productivity and user experiences collapse simultaneously under the weight of poorly managed infrastructure. To combat these delays, operations teams must deploy specialized software designed to analyze, monitor, and accelerate data traffic across distributed environments. By utilizing advanced diagnostics and automated routing platforms, companies can successfully eliminate unexpected downtime and bottlenecks. If you are eager to master these sophisticated infrastructure technologies, explore the expert-led training programs at Noopsschool to accelerate your engineering career. Selecting the right tools allows your business to maintain peak efficiency and lower data transmission costs.
Investing in top-tier optimization tools transforms how an organization handles fluctuating traffic demands. Modern utilities do not just flag issues after a failure occurs; they proactively predict constraints using historical data baselines and real-time telemetry. These platforms map complex system paths to give engineers total clarity over every device, circuit, and cloud connection in the pipeline. Consequently, having the right toolkit determines how quickly your infrastructure adapts to shifting operational challenges.
Understanding Network Latency and Its Core Components
To implement optimization software effectively, you must first master the architectural bottlenecks that cause data delays. Every network path experiences structural friction divided into specific technical categories, such as propagation, transmission, queueing, and processing delays. When data leaves a user’s device, it encounters physical and computational barriers that slow down its overall travel time. Identifying which component is degrading performance helps engineers choose the exact software utility required to fix the issue.
[Network Telemetry Source] ---> [Optimization Platform AI] ---> [Automated Path Selection]
Propagation Delay
Propagation delay represents the raw time required for an electrical or optical signal to travel through a physical medium like fiber-optic cables. Because nothing beats the speed of light, physical distance remains an absolute boundary for data speed. Optimization tools mitigate this by constantly measuring packet transit times across multiple global routes. This data allows software to dynamically reroute traffic through the shortest possible geographical paths.
Transmission Delay
Transmission delay dictates how long it takes to push all bits of a data packet onto the physical communication medium. This delay is directly tied to the raw bandwidth capacity of your network interface cards and hardware switches. Optimization tools monitor interface saturation to ensure your packets are not waiting to exit the local system. If transmission delays spike, the software alerts administrators to upgrade the local pipeline interfaces.
Queueing Delay
Queueing delay occurs when a router or switch receives more data than it can immediately process, forcing packets into memory buffers. If these hardware buffers fill up entirely due to sudden traffic spikes, the device begins dropping incoming packets mercilessly. Optimization software addresses this by tracking buffer utilization and applying smart traffic-shaping configurations across your active hardware.
Processing Delay
Processing delay involves the time a routing device takes to inspect packet headers, check for bit errors, and determine the next destination. Complex security policies and bloated routing tables heavily increase this processing time inside your infrastructure. Performance tools analyze these internal device metrics to find hardware processors that are running hot under heavy loads. By highlighting these specific delays, teams can simplify their routing logic or upgrade sluggish hardware.
Key Operational Concepts You Must Know
Successfully optimizing infrastructure requires a precise understanding of the interplay between network throughput, bandwidth, and latency. Bandwidth represents the maximum theoretical capacity of a connection, while throughput measures the actual volume of data successfully delivered. Optimization tools bridges this gap by identifying protocol inefficiencies that prevent throughput from reaching maximum bandwidth levels. Without these tools, engineers often make the mistake of buying more bandwidth when the true issue lies in unoptimized routing.
Furthermore, operations teams must monitor jitter and packet loss to maintain high-quality application delivery across the board. Jitter creates inconsistent packet arrival gaps, which completely ruins real-time communication tools and live video feeds. Packet loss causes massive slowdowns because protocols must stall transmissions to request re-delivery of the missing information. The following table highlights the core monitoring pillars that modern optimization tools track to keep systems healthy:
| Monitoring Pillar | Operational Focus | Primary Tool Metric | Target State |
|---|---|---|---|
| Flow Analytics | Traffic composition and bandwidth usage. | NetFlow, sFlow, IPFIX. | Balanced link distribution. |
| Synthetic Testing | Simulated user paths and link emulation. | Ping, Traceroute, HTTP tests. | Stable, predictable routing. |
| Packet Analysis | Deep packet inspection and error decoding. | Packet headers, retransmissions. | Zero dropped data packets. |
Platform Implementation vs. Culture — What’s the Real Difference?
Deploying network optimization platforms involves a dual approach that balances technical execution with organizational mindset. Platform implementation focuses entirely on the mechanics of rolling out software, installing monitoring agents, and configuring telemetry dashboards. These software installations give engineering teams the granular data needed to spot anomalies across cloud networks and physical data centers. However, installing these cutting-edge platforms yields little value if your engineering team lacks the operational habits to act on the data.
Culture defines how an organization prioritizes performance, treats alerts, and designs applications with network limitations in mind. A mature performance culture ensures that developers actively minimize API calls and compress payloads before deploying code to production. It also breaks down internal silos, allowing network operators and software engineers to collaborate on fixing latency bottlenecks together. The list below breaks down how tools and cultural habits interact across different engineering roles:
- Network Administrators
- Platform: Deploying global intelligence platforms to analyze multi-cloud BGP routing paths.
- Culture: Consistently reviewing traffic baselines to discover routing loops before they impact customers.
- DevOps Engineers
- Platform: Embedding full-stack observability tools into containerized application clusters.
- Culture: Setting strict latency budgets for every service micro-service and rejecting bloated software updates.
- Site Reliability Engineers (SREs)
- Platform: Configuring automated digital experience monitors to track internet paths.
- Culture: Conducting blameless post-mortems after network outages to fix structural design flaws permanently.
Real-World Use Cases of Modern Operations
Global e-commerce platforms utilize advanced network optimization tools to prevent shopping cart abandonment caused by slow loading times. During massive holiday sales events, sudden traffic surges can easily overwhelm regional data centers and third-party APIs. By using cloud-native observability platforms, these companies can dynamically shift user traffic away from degraded network paths. This real-time traffic redirection ensures that checkout pages load instantly, preserving revenue and customer trust.
Multi-national financial institutions rely heavily on network intelligence software to protect high-frequency trading networks from micro-burst congestion. These brief traffic spikes last only a fraction of a second but can cause massive queueing delays inside enterprise switches. Optimization tools continuously scan these high-speed links using deep packet inspection and sub-second sampling frequencies. This extreme visibility allows financial institutions to fine-tune their hardware queues and maintain a competitive edge in trading execution.
Telecommunications providers and managed service providers deploy scalable network monitoring tools to guarantee strict service level agreements for enterprise customers. Managing a vast footprint of software-defined wide area networks requires centralized visibility into every single customer link. Operators use automated discovery platforms to map out customer topologies and monitor live packet delivery metrics simultaneously. When a fiber line cuts unexpectedly, the optimization software triggers automated failovers to backup satellite or cellular links seamlessly.
Common Mistakes in Operations Engineering
A frequent error in network engineering is relying entirely on fragmented open-source point solutions that do not communicate with each other. Using separate, disconnected tools for packet analysis, flow telemetry, and device polling creates dangerous operational blind spots. When an incident occurs, engineers waste precious hours manually correlating data from different dashboards to locate the root cause. Upgrading to an integrated observability suite solves this issue by unifying all network telemetry under a single pane of glass.
Another widespread mistake is configuring overly sensitive alerting thresholds across your entire network infrastructure monitoring platform. Sending critical alerts for minor, temporary utilization spikes quickly causes severe alert fatigue within your engineering team. Overwhelmed operators begin ignoring notifications altogether, which inevitably leads to missing a real, catastrophic network failure when it happens. Engineers should implement intelligent, AI-driven anomaly detection that triggers alerts based on deviations from historical baselines rather than static limits.
Finally, many operations teams completely ignore public internet paths and third-party SaaS dependencies when monitoring their systems. Modern corporate applications rely heavily on external cloud hosting, public content delivery networks, and third-party payment gateways. If a core internet service provider experiences a major routing failure, your internal dashboards might show perfect health while your users experience total disruption. Teams must use synthetic internet testing to monitor the entire connection path from the end user to the application.
How to Become an Operations Expert — Career Roadmap
Mastering network optimization requires a dedication to learning foundational networking protocols alongside cutting-edge software automation tools. Aspiring engineers must start by learning how to analyze raw network traffic using command-line diagnostic utilities and packet sniffing software. Developing a deep understanding of TCP handshake mechanics and window sizing allows you to optimize connections at the operating system level. The following table provides a structured, multi-phase roadmap designed to elevate your technical skills into an operations expert:
| Career Phase | Skill Acquisition Focus | Primary Technologies | Operational Milestone |
|---|---|---|---|
| Phase 1: Analysis | Packet level decoding and interface diagnostics. | Packet sniffers, command-line tools, SNMP protocols. | Isolate localized packet drop root causes. |
| Phase 2: Management | Distributed monitoring and infrastructure scale. | Central monitoring platforms, topology mappers. | Build comprehensive enterprise topology maps. |
| Phase 3: Intelligence | Cloud telemetry, AIOps, and automated routing. | Global intelligence platforms, synthetics. | Architect self-healing global network paths. |
As you advance through your career roadmap, focus on building cross-domain expertise that merges classic network engineering with cloud-native DevOps methodologies. Learn how to write infrastructure-as-code scripts to automate the deployment of optimized network configurations across thousands of devices instantly. Additionally, study how machine learning models are used within modern software suites to predict future capacity constraints before they occur. This unique blend of traditional networking knowledge and software automation positioning makes you an invaluable asset to any modern enterprise.
FAQ Section
- What makes modern network intelligence platforms different from traditional performance monitoring software?Modern intelligence platforms combine traditional metrics with massive cloud flow telemetry and AI-driven analytics. This allows engineers to ask complex architecture questions and receive instant, evidence-backed routing analysis rather than manual graph comparisons.
- Can full-stack observability tools replace dedicated network sniffers entirely?Full-stack tools excel at connecting network performance data directly to application traces and container health metrics in cloud environments. However, for deep, byte-level packet debugging inside hardware firewalls, engineers still require dedicated packet analysis tools.
- How does sensor-based monitoring benefit smaller IT teams?Sensor-based monitoring allows smaller teams to quickly deploy predefined tracking modules for specific devices or cloud services. This approach minimizes setup complexity and delivers rapid time-to-value without requiring extensive custom script creation.
- Why is synthetic path monitoring critical for modern remote workforce environments?Synthetic testing continuously simulates user interactions from global locations to ensure corporate networks and applications are accessible everywhere. It allows IT teams to spot public internet routing issues affecting remote employees before those workers complain.
- What role does machine learning play in modern network optimization software?Machine learning algorithms analyze massive streams of historical telemetry to learn the normal operating baselines of your network. This capability allows the software to automatically spot subtle anomalies and prioritize alerts, drastically reducing manual troubleshooting times.
Final Summary
Achieving peak network performance requires a strategic selection of optimization tools tailored to your organizational infrastructure. From cloud-native observability platforms to deep network intelligence engines, the right software removes the guesswork from troubleshooting. Relying on outdated, manual diagnostic methodologies leaves your business vulnerable to costly service outages and user frustration. Implementing automated path analysis, synthetic testing, and intelligent alerting secures total visibility into your digital supply chain.
Ultimately, tools are only as effective as the engineering talent and operational culture supporting them behind the scenes. Organizations must continuously upgrade their technical skills, refine their alerting strategies, and design networks with proactive optimization in mind. Unifying powerful monitoring platforms with a performance-first mindset ensures your applications remain resilient against unexpected global internet disruptions. Investing in these core optimization capabilities guarantees a fast, reliable, and future-proof digital infrastructure.