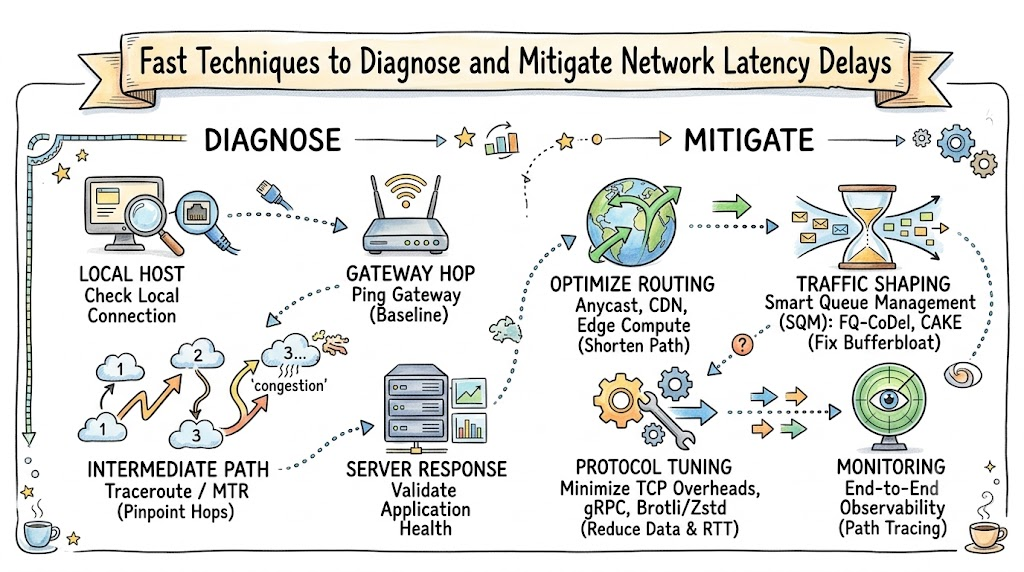
Network latency introduces sluggish response times that frustrate end-users and degrade digital service reliability. When packets encounter bottlenecks across local routers, transit providers, or overloaded destination servers, overall system throughput collapses. Diagnosing these bottlenecks systematically ensures that you apply targeted technical remedies rather than relying on guesswork. You can discover enterprise-grade architecture blueprints and hands-on operational training programs directly at Noopsschool to streamline your infrastructure performance. Implementing swift, data-driven diagnostic checks minimizes round-trip time (RTT) and preserves seamless connectivity.
Practical Diagnostic Steps to Trace High Latency
Before applying technical adjustments, pinpoint precisely where packet delays occur along the network path. Isolating client-side, transit, and server-side bottlenecks prevents unnecessary infrastructure overhauls.
[Local Host] ---> [Gateway / Router] ---> [ISP / Transit Hops] ---> [Target Endpoint]
   (Step 1)             (Step 2)                   (Step 3)                (Step 4)
Local Host Baseline Validation
Begin by ruling out endpoint issues on the immediate client machine. Heavy background tasks, saturation of the local interface, or packet drops on local virtual switches can mimic upstream network failure. Switching to a direct wired Ethernet connection eliminates radio frequency interference and channel overlap common to local wireless connections.
Gateway Hop Isolation
Verify connection health between the client device and the local default gateway. Send ICMP echo requests to your local router address to establish a clean zero-hop baseline. Delays above two to three milliseconds at this stage indicate immediate local hardware bottlenecks, cabling faults, or excessive bufferbloat.
Intermediate Route Mapping
Execute continuous path analysis using traceroute or MTR (My Traceroute) utilities to map the intermediary hops. Examining individual hop response times highlights exactly where sudden latency spikes or packet losses emerge. Sudden increases confined to an external autonomous system (AS) pinpoint upstream internet service provider (ISP) peering congestion.
Endpoint and Server Responsiveness
Evaluate target system responsiveness to ensure application thread contention is not impersonating network delay. Saturated CPU cores, I/O wait locks, or exhausted TCP connection pools delay socket acknowledgment times. Verifying system utilization confirms whether the delay stems from physical transmission paths or slow processing routines.
Key Operational Concepts You Must Know
Differentiating between latency, bandwidth, and throughput is essential when diagnosing slow network links. Bandwidth represents the total volume of data a link can theoretically transport per second, whereas latency represents the time duration required for a packet to transit from origin to destination. High bandwidth does not prevent packet delay if the physical route involves extensive distance or inefficient routing.
Throughput represents the actual data successfully delivered across the communication channel. Because transmission control protocols require acknowledgments, latency acts as a hard cap on effective throughput regardless of available pipe capacity. The comparative overview below clarifies these operational distinctions:
| Operational Metric | Technical Definition | Primary Root Factor | Core Resolution Focus |
|---|---|---|---|
| Network Latency | Round-trip duration for data packets. | Physical distance and hop processing. | Anycast routing and edge distribution. |
| Link Bandwidth | Theoretical data carriage capacity. | Physical medium and link port speeds. | Interface upgrades and trunking. |
| Active Throughput | Rate of successfully delivered payload. | Window sizes, packet loss, and latency. | Protocol tuning and congestion control. |
Understanding jitter and packet loss completes this operational foundation. Jitter represents variance in packet arrival intervals, which causes choppy multimedia streaming and broken real-time socket connections. Packet loss forces transport protocols to stop transmission while negotiating packet retransmissions, creating massive latency spikes. Mastering these core concepts helps teams immediately identify the source of network slowdowns.
Platform Implementation vs. Culture — What’s the Real Difference?
Achieving persistent low latency requires both technical platforms and a disciplined organizational culture. Platform implementation centers on deploying specialized hardware, content delivery distribution nodes, smart traffic shapers, and real-time observability telemetry. These systems provide the mechanical framework to discover, route, and deliver packets across the shortest available paths.
Culture represents the operational standard that dictates how engineering teams prioritize efficiency throughout the development lifecycle. A team lacking a low-latency culture frequently designs applications with redundant API round-trips, bloated network payloads, and unindexed remote database queries. Technical platforms cannot compensate for inefficient software design patterns. The list below illustrates how platform tools and cultural habits interact across primary engineering functions:
- Site Reliability Engineers
- Platform: Deploying global Content Delivery Networks (CDNs) and distributed ingress controllers.
- Culture: Establishing enforceable Service Level Objectives (SLOs) focused strictly on packet round-trip times.
- Backend Software Developers
- Platform: Utilizing binary RPC frameworks and efficient persistent socket connections.
- Culture: Auditing payloads to eliminate extraneous serialization overhead and redundant network round-trips.
- Network Operations Teams
- Platform: Implementing automated Border Gateway Protocol (BGP) traffic routing optimizations.
- Culture: Reviewing inter-region packet traces proactively rather than reacting to user complaints.
Aligning modern platform tools with a strict operational culture prevents compounding technical debt. Modern platforms supply the necessary real-time metrics, while a dedicated team culture ensures that performance budgets remain non-negotiable. Combining these elements ensures that network infrastructure stays performant under heavy global traffic.
Real-World Use Cases of Modern Operations
Automated financial trading platforms demonstrate how low-latency operations perform under demanding parameters. In financial exchanges, sub-millisecond delays directly translate to execution failures and market slippage. To address this, infrastructure engineers configure kernel-bypass networking protocols and co-locate server racks directly adjacent to matching engine data centers. This configuration eliminates physical propagation delays, maintaining instantaneous transaction processing speeds.
Global interactive streaming architectures provide another compelling operational example. Modern streaming platforms must maintain sub-second video latency for millions of concurrent interactive viewers. Engineers accomplish this by shifting content ingestion, audio-video processing, and caching layers to regional edge compute instances. By processing media data closer to user internet service providers, systems avoid the unpredictability and congestion of transit backbones.
Connected healthcare services and remote telemetry monitoring systems depend entirely on deterministic packet arrival. During distributed medical operations, robotic telemetry signals require continuous, uninterrupted transmission. Network operators implement strict Quality of Service (QoS) configurations alongside dedicated multiprotocol label switching tunnels. These dedicated pipelines isolate mission-critical health telemetry from ordinary public internet congestion.
Common Mistakes in Operations Engineering
A frequent miscalculation in operations engineering is purchasing additional bandwidth to resolve latency issues. Bandwidth increases the total volume of data carried concurrently, but it cannot alter the physical speed of packet transmission. If delays originate from long geographical routes or unoptimized router hops, extra bandwidth leaves latency metrics completely unchanged.
Unoptimized (Oversized Buffers):
[Packets Arriving] ---> [ ====== MASSIVE QUEUE (Buffers Full) ====== ] ---> [Interface Saturated]
                               (Queueing delay spikes to hundreds of ms)

Optimized (Active Queue Management):
[Packets Arriving] ---> [ === Small Managed Buffer === ] ---> [Interface Streamed]
                               (Tail drop / ECN prevents delay)
Another common oversight is neglecting bufferbloat across routing hardware. Excessive buffer sizes in switches and network routers hold queued packets indefinitely instead of dropping them during high volume. This behavior creates severe queueing delays that degrade voice and real-time data flows. Implementing active queue management algorithms such as FQ-CoDel or CAKE prevents buffers from causing latency spikes.
Teams also often fail to configure end-to-end network path telemetry. Monitoring only target server uptime leaves engineers blind to intermediate routing changes and regional ISP peering bottlenecks. Without continuous path tracing, intermittent packet loss across transit hops remains invisible. Comprehensive external synthetics ensure anomalies are identified before users notice degradation.
How to Become an Operations Expert — Career Roadmap
Transitioning into a senior operations specialist requires mastering protocol fundamentals alongside cloud automation. Beginning engineers must build deep familiarity with packet analysis tools, Linux socket operations, and core routing behaviors. Developing this fundamental fluency allows operators to dissect packet captures and detect anomalies quickly. The structured progression table below highlights key milestones for developing this operational expertise:
| Career Phase | Practical Knowledge Areas | Target Technical Tooling | Operational Milestone |
|---|---|---|---|
| Tier 1: Foundations | Network OSI, TCP/IP handshake, DNS. | Wireshark, MTR, Ping, NetFlow. | Isolate hop delays using packet traces. |
| Tier 2: Infrastructure | Linux kernel tuning, routing protocols, QoS. | BGP routing engines, eBPF, NGINX. | Configure automated traffic shaping. |
| Tier 3: Distributed Systems | Anycast deployment, edge computing, CDNs. | Terraform, Kubernetes, Envoy. | Design global, low-latency topologies. |
Advancing beyond foundational operations requires exploring programmable data planes and global routing orchestration. Experiment with eBPF to inspect kernel networking behavior and detect packet delays without adding monitoring overhead. Engage with production incident reviews and open-source infrastructure projects to strengthen your real-world troubleshooting skills. Combining low-level networking knowledge with automation will set you apart as a reliable infrastructure expert.
FAQ Section
- How does ping testing differ from tracing network latency?Ping measures round-trip time between a source and a destination using ICMP echo packets. Latency is the broader measurement of time delay across a network path. Ping is the tool used to verify whether high latency exists.
- Why does physical distance consistently cause baseline network latency?Signals must travel across physical mediums like fiber-optic cables or copper wires, bounded by the speed of light. Transcontinental or undersea cable journeys naturally take several dozen milliseconds simply to bridge the geographical gap.
- Can migrating to HTTP/3 help lower application-level latency?Yes, HTTP/3 utilizes the UDP-based QUIC protocol, which eliminates head-of-line blocking found in older TCP connections. It also enables single-round-trip or zero-round-trip handshakes, accelerating initial connection setup times.
- What steps resolve bufferbloat on local office routers?Update router firmware and enable modern Smart Queue Management (SQM) algorithms like FQ-CoDel or CAKE. These algorithms prioritize interactive, latency-sensitive packets while preventing large file transfers from saturating network memory buffers.
- How does Anycast DNS lower overall network lookup delays?Anycast DNS routes lookup requests to the nearest operational server using Border Gateway Protocol path calculations. Connecting users to geographically closer DNS resolvers reduces round-trip times for domain name resolution.
Final Summary
Quickly resolving network latency problems requires methodical diagnostics rather than ad-hoc infrastructure changes. Systematically tracing delays from the local client across intermediary hops to the destination server highlights the exact source of performance bottlenecks. Addressing these issues using modern traffic management, smart routing, and active queue configurations permanently eliminates unnecessary packet delays.
Relying solely on bandwidth expansions fails to solve propagation and queueing delays across distributed networks. Sustainable performance requires deploying resilient edge infrastructure alongside a team culture committed to optimizing network payloads. By applying structured path tracing, tuning device buffers, and implementing modern transport protocols, engineers can maintain fast and reliable network connectivity.